Programming in finance

On the Design Board: From Single- to Multi-Curve

Introduction

Standard fixed-income applications make a larger and larger use of the multi-curve framework to price products and hedge risks. For whatever reason this is the case, it is useful to know how to implement such a framework.

We have already talked about multi-curves in the past. Here we gave a list useful references and here we illustrated the mean features of risk metrics and sensitivity patterns. In this blog, we describe how to design the multi-curve framework. We do not claim that this is the only way or the best way. This is one possible way, which however turned out to work quite well within our system and happened to be easily integrated into our library.

Code snippets that will be shown below have been developed in C# using Visual Studio. Continue reading
Intuitions From The Multi-Curve Framework

How can we hedge within the multi-curve framework?

Let’s consider a simplified case. Our building blocks will be swaps only of various tenors and maturities with the following purposes:

  • Discounting instruments: we use 1-month tenor swaps of various maturities to construct the discounting curve.
  • Tenor instruments: we use 3-months, 6-months and 12-months tenor swaps to construct the forward curves. We denote them as 3M, 6M and 12M.

The exact swap data are given in the attached spreadsheets [a] and [b]. In particular:

  • the Data tab contains details of the input data and convention used in the calculation;
  • the Rows tab contains the matrix with the PV01s/IV01s of all the input instruments as rows;
  • the Columns tab contains the actual PV01/IV01 matrices as the transpose of the matrix in the previous tab;
  • our notation in these examples is that all the curves are ordered by discounting type (the first one is always the discounting curve) and increasing tenors.

Continue reading

Bootstrap approach for CDS spreads

In this blog we consider the hazard (or default) rate implied by Credit Default Swaps (CDS). In specific we compare a simplified CDS-spreads-based model against a bootstrap procedure. Surprisingly we find that the simplified approach works well in the current low-interest rate market. Our findings are based on a piecewise linear hazard rate curve. The nodes for these curves are obtained using either the simple model or the bootstrap approach.

Continue reading

Credit Default Swaps : First Steps with Example

A Credit Default Swaps (CDS) is a derivative to transfer default risk from one party to the next. The default protection is granted on the reference entity which can in principal be any entity, for example a single company, a group of companies or even a country. The protection buyer makes (quarterly) payments as compensation for the protection until either the end of the contract or the moment of default of the reference entity. This structure results in the pricing of this leg containing a part for the value of the payout in case of default and a part for the accrued premium until default. This side of the swap is called the premium leg.

The protection seller pays out a fixed amount in case of default of the reference entity. This amount is usually quoted as the notional amount times a recovery fraction. This side of the swap is called the protection leg.

To get a feel for the pricing of these kind of swaps please consider the simple attached example based on the book of Hull. In this example the CDS price is computed based on deterministic default probabilities and a fixed interest rate. To get a more realistic pricing, we could change the fixed interest rate with an interest rate model and the deterministic default probability with a stochastic model. However, that aside, we think this example gives a good basic understanding of how a CDS works. 

The CDS example spreadsheet is available here : cds example

Multi-Curve - Useful References

We have recently started the project of including the multi-curve framework into the UDFinLib, our own financial library. The topic is delicate, as it consists of both research and implementation at once.

After the 2007-2008 world financial crisis it became clear that the classical single-curve framework that had been used until then was not appropriate to value products and to hedge portfolio's positions. All of a sudden credit risk was an every day's topic, collateral margins exploded and the previously small spreads between different-tenor swaps (OIS vs Libor, 3M-tenor vs 6M-tenor) could not be neglected anymore. Single-curve building, which treated instrument with different tenors in the same way, had to be upgraded to multi-curve.

In a nutshell, the multi-curve framework amounts to construct one discount curve and many tenor curves. The discount curve is typically built with OIS instruments, which are the best approximation for the risk free rate. All the other tenor curve are built with instruments with homogeneous tenors. The most used tenors are 3M, 6M, 9M, 12M. Typically, the longer the tenor the riskier the trade and hence the higher the corresponding rate.

In this blog we give a non-exhaustive list of references that helped us in both understanding the multi-curve and designing the process.

Articles

Books

Nice reading!

Theta - Critical Note

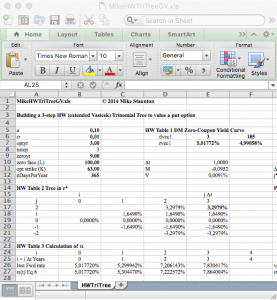
In a previous blog we presented an implementation of the Generalised Hull-White model (2014). This implementation relies on a numerical root-finding routine to determine model parameters so that model prices match actual market prices. The root finding is far from trivial as different algorithms will give different results. Fortunately the quality of the result can be easily monitored as the difference between model prices and actual marked prices is a clear indicator. As it turns out in most cases, the root finding for theta is not required. Instead an analytical formula can be used. Mike Staunton very kindly pointed us to a paper by Grant & Vora (2001) that shows that the approximation used by Hull-White is not necessary. The equations explained in the paper are implemented in the attached spreadsheet by Mike Stauton for the first 3 steps of the lattice giving a good example of how the process for finding theta works in practice.


blog theta


The spreadsheet is available here:

MikeHWTriTreeGV


References:

Grant & Vora (2001) , An Analytical Implementation of the Hull and White Model

http://janroman.dhis.org/finance/Hull%20&%20White/analytical-approximation-hull-and-white.pdf


Hull & White (2014), A Generalized Procedure for Building Trees for the Short Rate and its

Application to Determining Market Implied Volatility Functions

http://www-2.rotman.utoronto.ca/~hull/downloadablepublications/TreeBuilding.pdf

Review of Lattice Construction Methods

Just before year end we put out our paper, titled "Review of Lattice Construction Methods"!

lattice

This paper extends the generalized procedure for building trees for short rates by Hull & White. A generalization for any mean and standard deviation of the underlying short rate model is presented. In addition we review the methodologies for constructing lattice models and give a step-by-step explanation on how to construct trinominal trees. We apply the formalism to some explicit examples of various complexity.


Full text can be found here


World Finance Conference Talk 2015 - The Geometry of Interest Rate Risk

In this talk the process of interest rate risk management is considered. The yield curve construction is revisited and emphasis is given to aspects such as input instruments, bootstrap and interpolation. For various financial products new formulas are presented that are crucial to define sensitivities to changes in the instruments and/or in the curve rates. Such sensitivities are exploited for hedging purposes. The risk space is constructed, which eventually turns out to be a curve property, and show how to hedge any product or any portfolio of products in terms of the original curve instruments. Continue reading

Theta : A Test for Short Rate Model Lattice

While short rate models have lost ground to libor market models for valuation of (complex) interest rate derivatives, they remain popular for Asset and Liability Management. As a result you may find yourself implementing a short rate model. Often the choice is to implement a lattice approach, perhaps in combination with a Monte Carlo framework. One critical step in these models is to match the model discounts to the ones observed in the market. This makes to model (almost) arbitrage free. To match the market a numerical root finding algorithm needs to be used, for example Newton Raphson. This poses the challenge that mistakes in the model may not be obvious as the root finder can still find parameters to match the market even though there are mistakes in the model. Our suggestion is to check the root finder solution to known analytical solution of the Hull White model using functional form for the zero curve that is continuous and two times differentiable.

Continue reading

Generalized Procedure for Building Short Rate Trees in Excel / VBA using LevmarExcel

In a previous we blog we reproduced example 1 of the  2014 paper John Hull and Alan White “Generalized Procedure for Building Short Rate Trees”. In the paper the authors derive a generalized method for the construction of short rate trees. This generalization is interesting as it allows for one tree (or lattice) construction algorithm for all one-factor short rate models. Continue reading