In this blog we consider the hazard (or default) rate implied by Credit Default Swaps (CDS). In specific we compare a simplified CDS-spreads-based model against a bootstrap procedure. Surprisingly we find that the simplified approach works well in the current low-interest rate market. Our findings are based on a piecewise linear hazard rate curve. The nodes for these curves are obtained using either the simple model or the bootstrap approach.
Simple Model
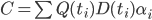
Given a CDS spread, one can compute the hazard rate as

Here  denotes the CDS spread and
  the recovery rate. This formula is derived in Brigo and Mercurio [1] page 735. It is however only an approximation, as it considers continuous payments in the premium leg, which is not the case in practice. It is a market convention for a CDS to pay premiums quarterly. In addition the implied hazard rate term structure from the CDS market is ignored as only a single spread is considered. To make it possible to compare it with the bootstrap model, we apply linear interpolation between the hazard rates.
Bootstrap Approach
The bootstrap approach is an iterative approach to recover hazard rates from the market. We do so by starting with the shortest-maturity CDS, then considering the next-to-shortest maturity and so forth until all swaps have been added to the term structure. When adding a swap we use the “mid-point” valuation as explained in Marchioro [3]. According to this method, coupons are always paid at coupon dates and defaults can only occur in the middle of two coupon payments. This is a numerical approximation of the model-independent formulas for the CDS valuation as presented by Brigo and Mercurio on page 733 equations 21.22 and 21.23. We then find:

Here  is the protection leg,
  coupon payments and
  the accrued coupon. They are computed as

where


Here  gives the discount factor implied by the current yield curve term structure. This approach is implemented in the spreadsheet attached to this blog. More details on the CDS valuation methodology used can be found in Hull [2] and Marchioro [3]. A worked example in Excel can be found here on our site.
Results
We consider the current market as a starting point.
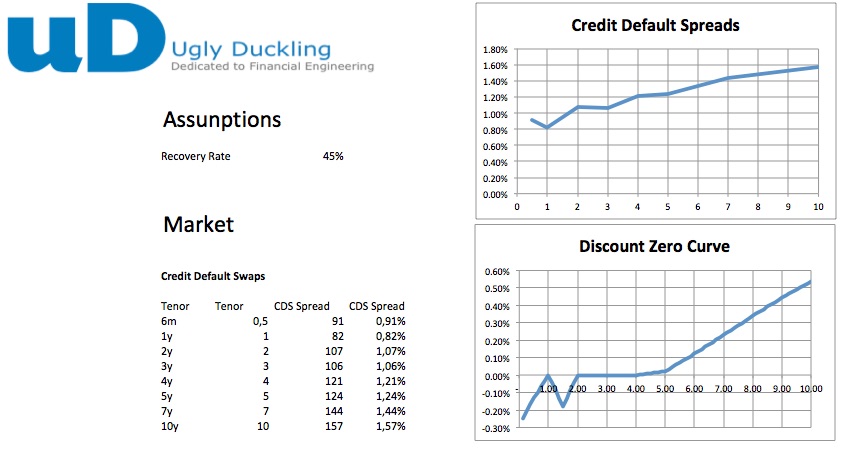
Figure 1 : Screen Capture Example Spreadsheet - Market Data
Given the current market (March 2016) we see surprisingly small difference between the simple and the bootstrap approach. To investigate this further we consider two more cases: flat interest rate of 0% and 5% respectively. Looking at these two cases we hope to discover if the difference between the two approaches is always small or if it is so only in the case of low interest rate environment.

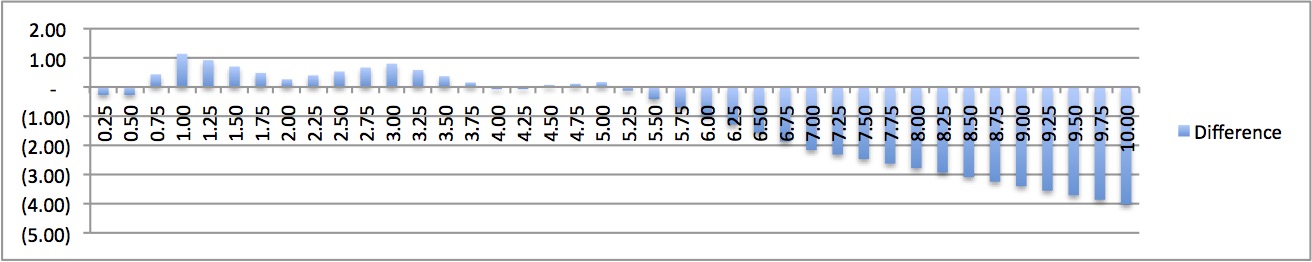
Figure 2 : Screen Capture Example Spreadsheet - Result Current Market
Considering the same CDS quotes, but now using a flat yield curve base on 5% zero rates we see a different picture. The simple approach still yields the same result as it is independent of interest rates. For the bootstrap approach this is not the case as it does use discounts (and thus the term structure of interest). For this case we do see that the difference between the methods increase.
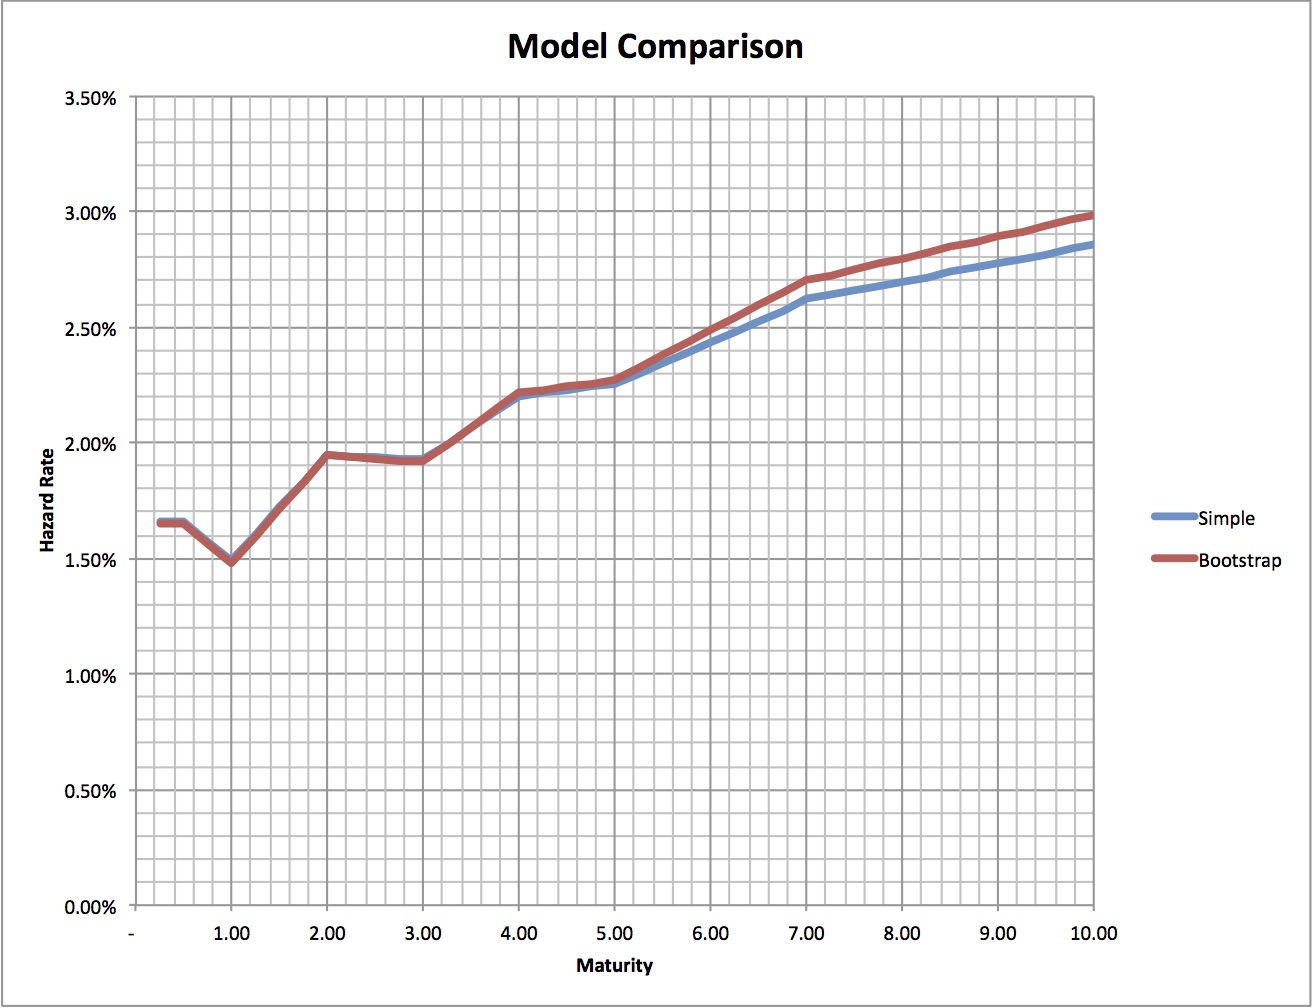
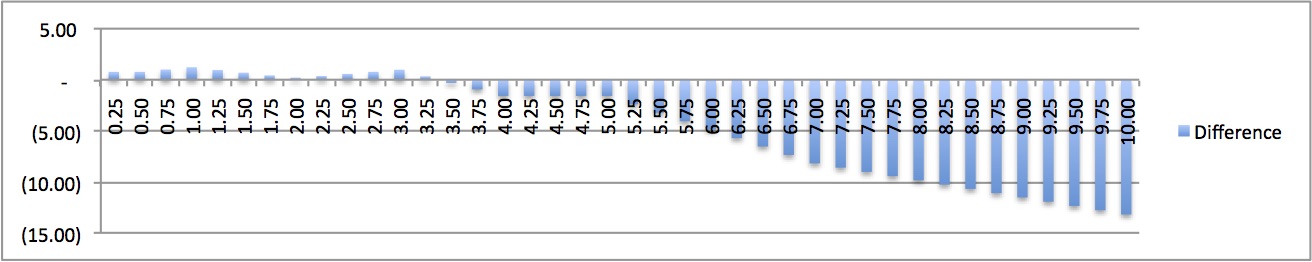
Figure 2 : Screen Capture Example Spreadsheet - Result 5% flat interest rate
Again considering the same CDS quotes, but now using a flat yield curve base on 0% zero rates we see similar picture to the current market situation. The simple approach still yields exactly same result. For the bootstrap approach the result is very close as current market rates are close to 0% for most of the relevant term structure. Here the difference between the two methods is very small.
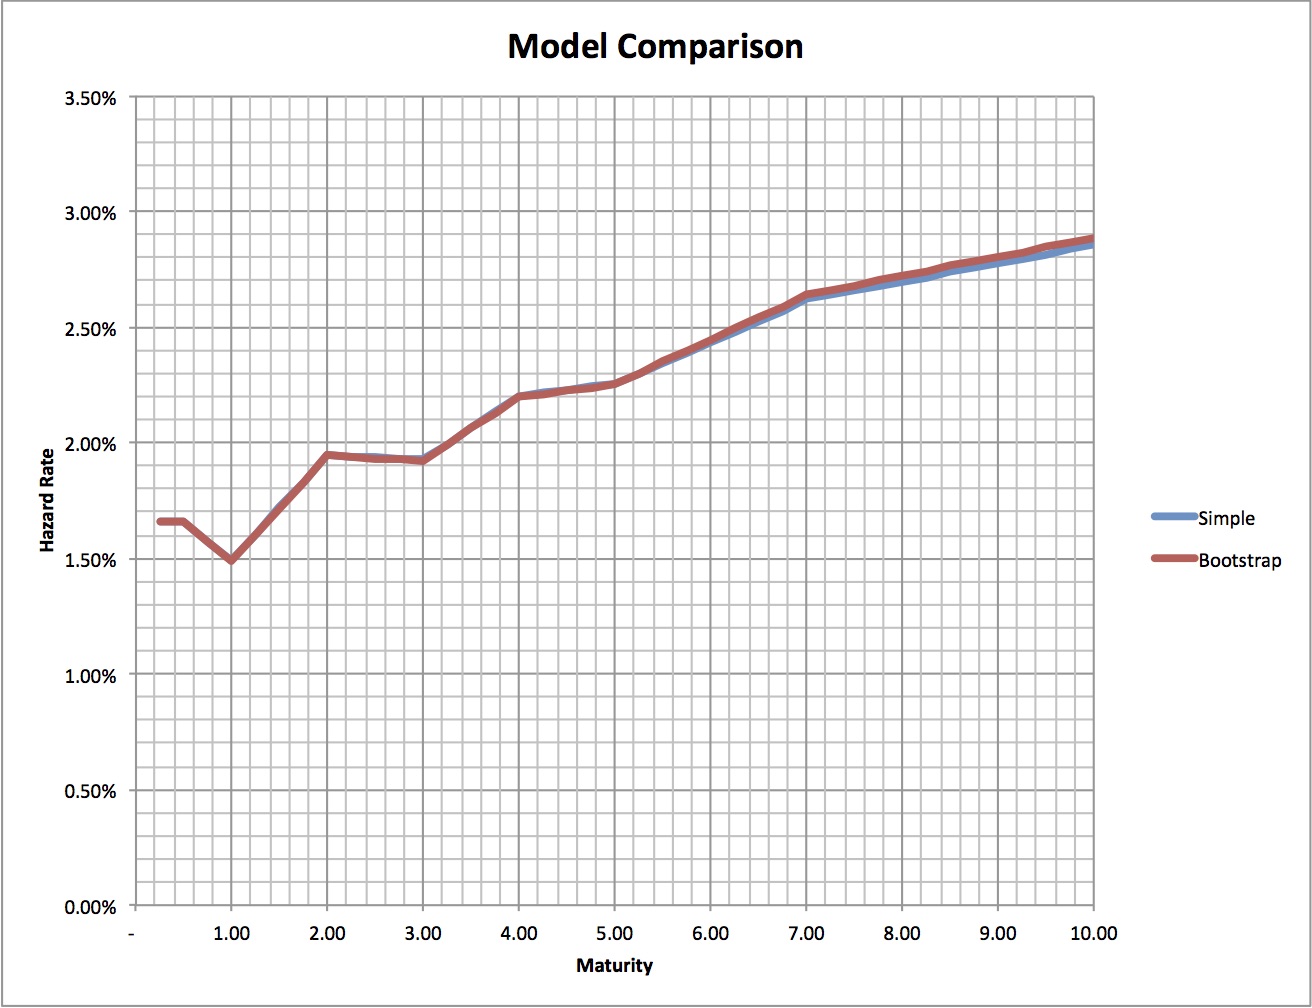
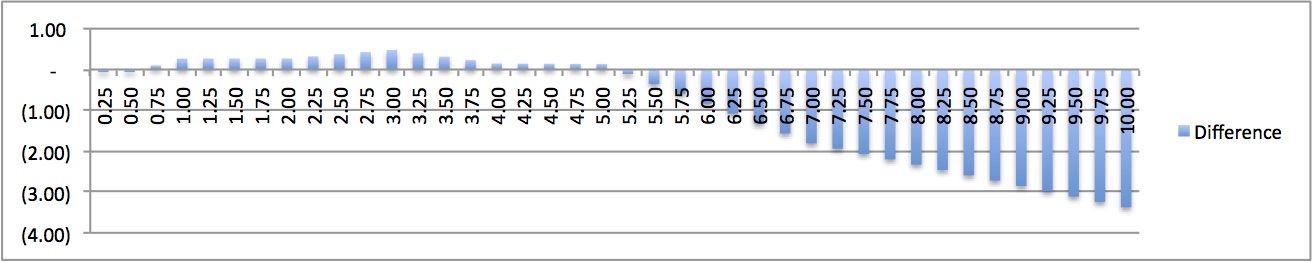
Figure 3 : Screen Capture Example Spreadsheet - Result 0% flat interest rate
Conculsion
In this blog we have compared two approaches to extract the credit default term structure or hazard rate from the Credit Default Swap (CDS) market. First we have used the simplest possible model, referred to as simple model, which can be implemented directly on market quotes. The simple model directly determines individual hazard rates and then linear interpolation is applied to get a term structure. The bootstrap methodology uses the "Mid-Point" rules in combination with iterative method (commonly referred to as bootstrap) to construct the hazard rate term structure. Surprisingly, the two methods yield very similar results in the current low interest-rate environment we currently see in the EURO-zone. However, the simple model will become less accurate as rates increase.
Attachment
The example spreadsheet is available here:
CDS bootstrap - Mid Point - v1.0
References
[1] Brigo and Mercurio, Interest Rate Models: Theory and Practice - With Smile, Inflation and Credit, 2nd Ed. (2006)
[2] Hull, John. Options, Futures, and Other Derivatives, 7th Ed (2008)
[3] Marchioro, Pricing Simple Credit Derivatives Marco, 2009
Available here : http://marchioro.webs.com/White-papers/intro-credit-derivatives.pdf