In a previous blog we showed how to visualise stock prices for Deutsch Bank using core graphics functionalities of Octave. In this blog we will take a look at some finance-specific plot types available in the Financial Package on Octave Forge. This blog will show how to fetch some price data for Apple and use the data to make a:
- High Low plot
- Bolling Bands plot
- Point Figure plot
- Renko plot
First we will consider snippets of code to download data and create each type of plot. In the appendix a complete listing of code is given so you can easily reproduce the results on your own machine.
Using Fetch to get data
Fetch takes most of the work out of gathering a dataset for your analysis work. For no particular reason we downloaded Apple stock prices for the first quarter of 2016 to use for our example here. In theory fetch can be used to get data from any web-service, but there are pre-configured connections for Yahoo and Google finance that are used here. Consider this code snippet:
connection = yahoo();
ticker = 'AAPL';
fromDate = "01-Jan-2016";
endDate = "30-Mar-2016";
frequency = "d";
[d f] = fetch(connection, ticker, fromDate, endDate, frequency);
d = flip(d);
First create the connection for Yahoo and set the ticker you want to retrieve. If you don't know the ticker visit Yahoo and search for the company name you are interested in. Now you are ready to download the data using fetch. The fetch returns the data in a matrix with in the columns date, open, high, low, close, adjusted close and volume. Yahoo puts the oldest date first so remember to flip the data or your plot will read from right to left, which is strangely enough a hard thing to do. To make the code easier to read we introduce:
dates = d(:,1);
openPrice = d(:,2);
high = d(:,3);
low = d(:,4);
closePrice = d(:,5);
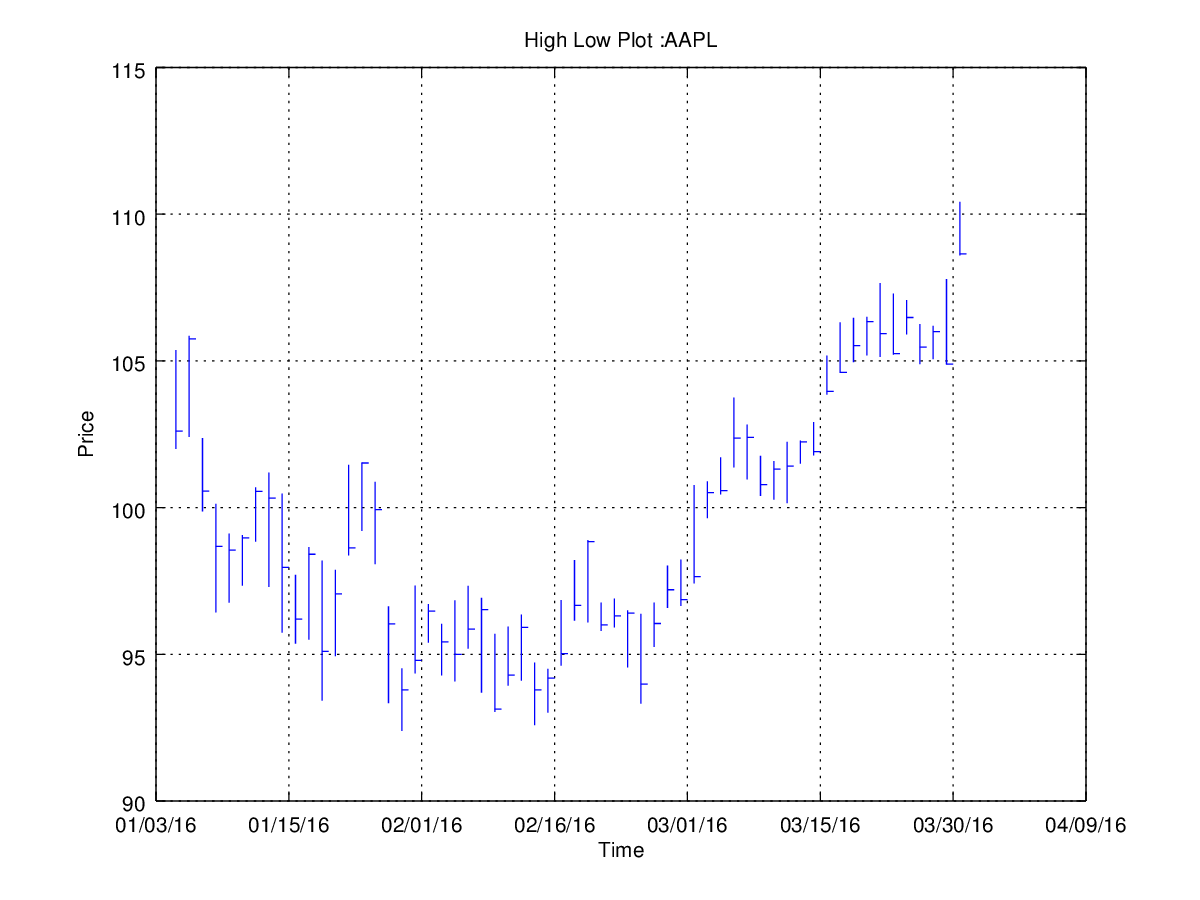
High Low Plot
The High Low plot displays the open, high and low prices. This give an indication of the price moves during the day and the direction of the move as of open. Looking at the plot, we see that there are a couple of days when Apple opened on the lowest point of the day with a large spread between high and low. These must have been good days to hold the Apple stock.
highlow(high, low, openPrice);
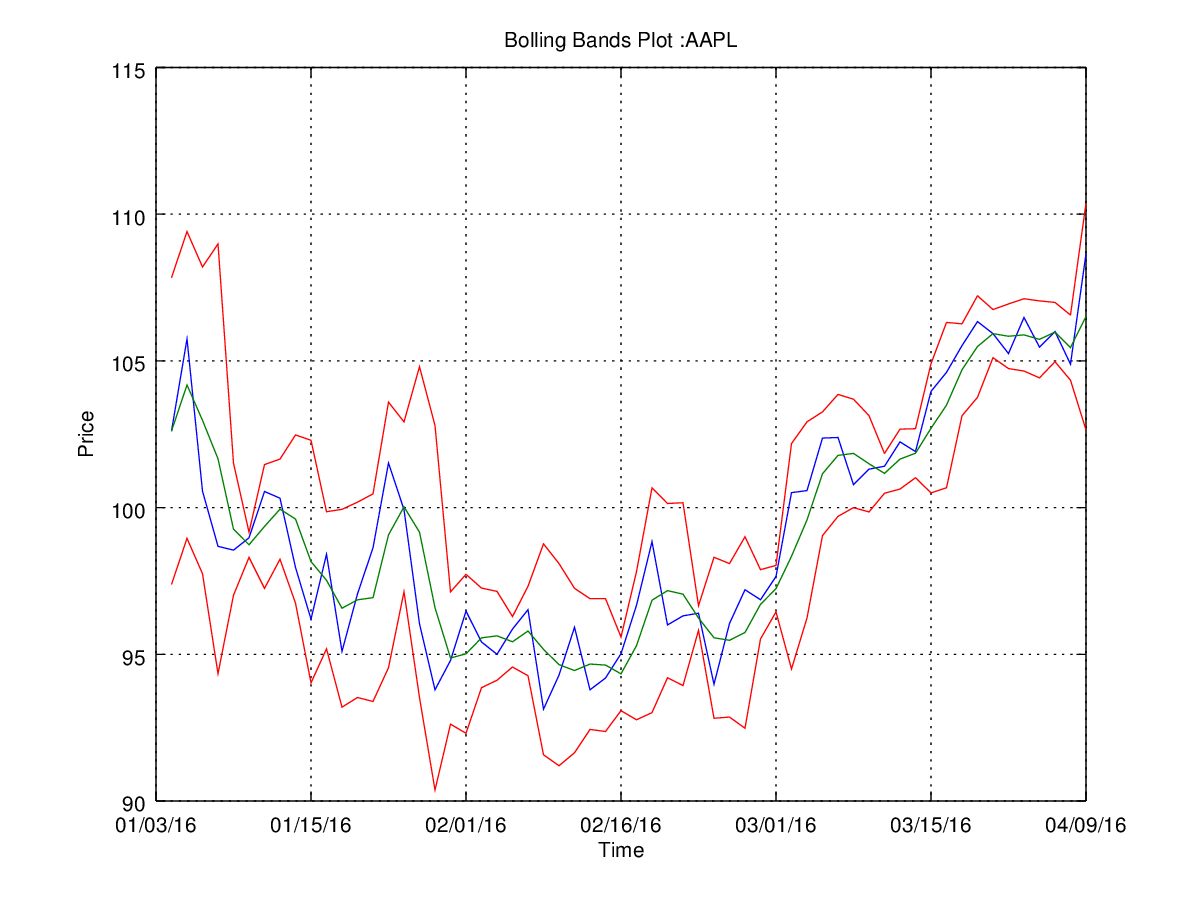
Bolling Bands Plot
The Bolling plot gives us a plot of the prices (blue line), the moving average (green line) and the 2 standard deviations up and down (red lines). The idea is that these plots can provide information about price being high or low. A more detailed description of its purpose is given on Wikipedia:
The purpose of Bollinger Bands is to provide a relative definition of high and low. By definition, prices are high at the upper band and low at the lower band. This definition can aid in rigorous pattern recognition and is useful in comparing price action to the action of indicators to arrive at systematic trading decisions.
bolling(openPrice,3)
Point Figure
A Point Figure chart is a chart consisting of x's and o's. The x denotes a rising price and the o denotes a failing price. By stacking x and o's in a columns one can quickly get an overview of price movements. Analysts use these charts to find price supports and resistance levels.
pointfig(openPrice)

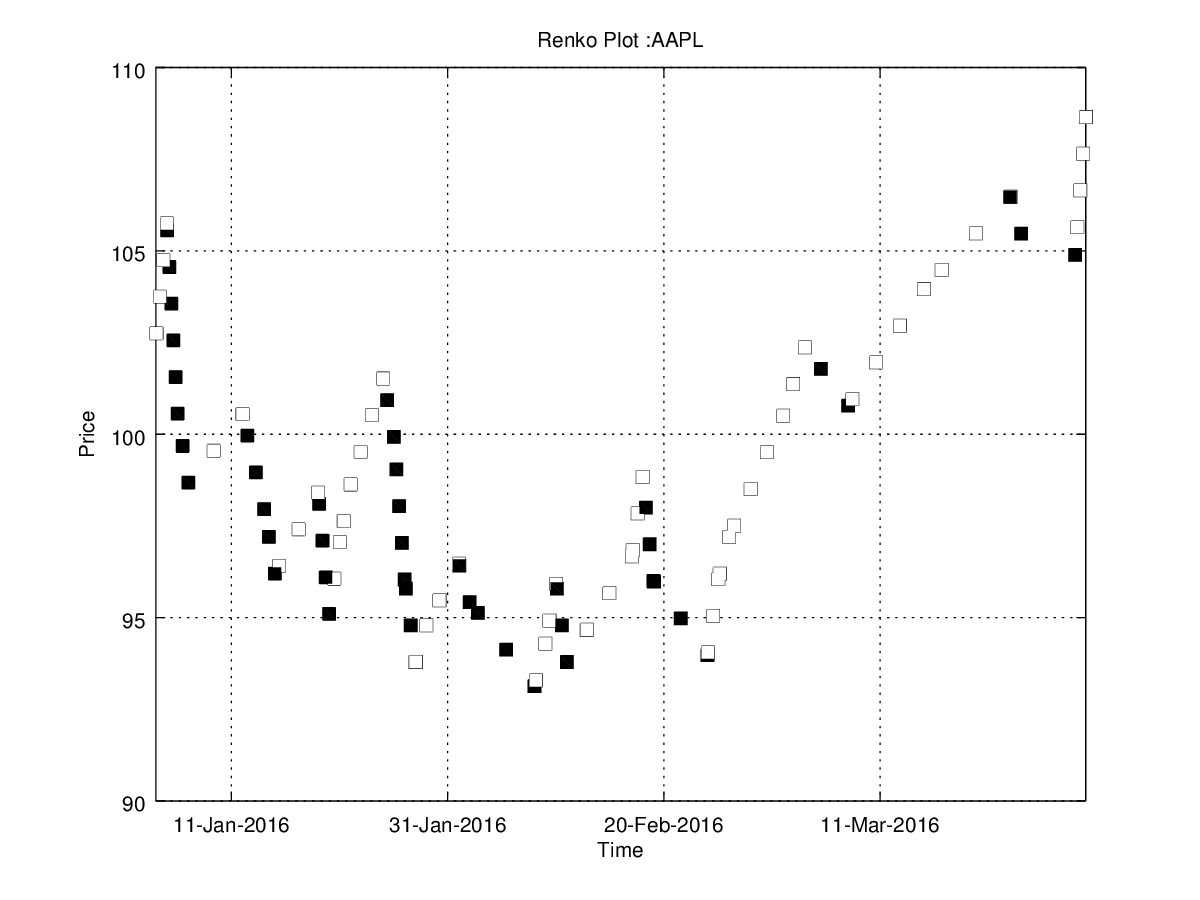
Renko
Differs from standard plot as it only considers price changes larger than a certain treshold. In this case the default of a treshold of 1 is used. The Renko chart results in less wilde or choppy chart as it only considers larger price moves. To increase readability of the plot, price increases are visualised by the white markers and price decreases are marked by black markers.
renko([dates openPrice])
Appendix : Code Listing
plotTickerData
% requires packages:
% - io
% - statistics
% - financial

% Clear existing
clear;
close all;

% Load package
pkg load io;
pkg load statistics;
pkg load financial;

% Grab data
% format = {Date,	open,	High,	Low,	close,	Adj close*,	Volume}
connection = yahoo();
ticker = 'AAPL';
fromDate = "01-Jan-2016";
endDate = "30-Mar-2016";
frequency = "d";
[d f] = fetch(connection, ticker, fromDate, endDate, frequency);
d = flip(d);
dates = d(:,1);
openPrice = d(:,2);
high = d(:,3);
low = d(:,4);
closePrice = d(:,5);

% Plot data
h=figure(1);
highlow(high, low, openPrice);
titlestr = strcat('High Low Plot : ', ticker)
layout(gca, ticker, dates, titlestr);
defaultSavePlot(h, "highlow.png");

h=figure(2);
bolling(openPrice,3)
titlestr = strcat('Bolling Bands Plot : ', ticker);
layout(gca, ticker, dates, titlestr);
defaultSavePlot(h, "bolling.png");

h=figure(3);
pointfig(openPrice)
titlestr = strcat('Point Figure Plot : ', ticker);
layout(gca, ticker, dates, titlestr);
defaultSavePlot(h, "pointfig.png");

renko([dates openPrice])
title(gca, strcat('Renko Plot : ', ticker));
xlabel(gca, 'Time');
ylabel(gca,'Price');
grid on;
defaultSavePlot(gcf, "renko.png");
layout
function layout(handle, ticker, dates, titlestr)
  title(titlestr);
  grid on;
  ticks = get (handle, "xtick");
  labels = [dates(ticks(2:size(ticks,2)-1))];
  labels = [dates(1)-1 transpose(labels) dates(size(dates,1)) + ticks(size(ticks,2)) - ticks(size(ticks,2)-1)]
  set (handle, 'xticklabel', datestr(labels,2))
  xlabel('Time');
  ylabel('Price');
end
defaultSavePlot
function x = defaultSavePlot(plotHandle, name)
  W = 8; H = 6;
  set(plotHandle,'PaperUnits','inches');
  set(plotHandle,'PaperOrientation','portrait');
  set(plotHandle,'PaperSize',[H,W]);
  set(plotHandle,'PaperPosition',[0,0,W,H]);
  print(plotHandle,'-dpng','-color', name);
end
Great work, guys! I think Octave does not allow the use of "fetch" anymore, though. Have you been able to get another tool in Octave to achieve the same objectives? I'd be very glad to hear about it.
Greetings!