Author: Michele Maio

Standard Formula and Solvency Capital Requirements

We have recently finished a project with an international insurer whose headquarters is in the Netherlands Randstad area. The experience was extremely satisfactory, mainly due to the interactions with the quant development group, which was very knowledgable and provided a pleasant working environment, and the topic under investigation, which was the construction of a system to compute economic capital requirements of the firm. Hence it is interesting to remind ourselves of some of the regulatory requirements behind the insurance business.

Generically, economic capital requirements are attached to the solvency word, which denotes the degree to which assets exceed liabilities. The difference (if positive) is also known as own funds. Such Solvency Capital Requirements (SCR in short) are dictated the European Insurance and Occupational Pensions Authority (EIOPA), which will be referred to as the regulator in the rest of this post. In mathematical terms, capital requirements are Values at Risk (VaR's), hence variances at given confidence levels.

One such regulatory requirement is known as the Standard Formula. As the name suggests, this is a standardised calculation that all the firms are asked to implement. However, it might not exactly reflect the risk profile of any specific entity and moreover, some risks might be relevant for some entities only, while completely irrelevant for others. Our main reference for this post will be the original EIOPA documentation which can be found here or here.

In the the Standard Formula calculations the various sources of risks are organised into a hierarchical structure (see picture). The root node represents the Basic Solvency Capital Requirement (BSCR) for the whole firm.

SF risk hierarchy

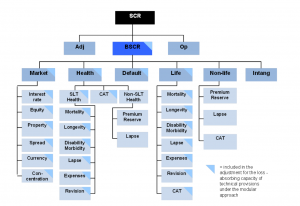
A capital requirement is calculated for each module in the risk hierarchy. All the capital requirements at each level are then aggregated into the parent level by using correlation matrices. The correlation parameters are chosen in such a way that the calculated SCR best approximates the 99.5% VaR over a one-year period of the aggregated capital requirement. In formulas, for two risk factors X and Y, the correlation parameter rho minimises the absolute difference:

Aggregation with correlation

Let's now look at each risk source in more details. Continue reading

On the Design Board: From Single- to Multi-Curve

Introduction

Standard fixed-income applications make a larger and larger use of the multi-curve framework to price products and hedge risks. For whatever reason this is the case, it is useful to know how to implement such a framework.

We have already talked about multi-curves in the past. Here we gave a list useful references and here we illustrated the mean features of risk metrics and sensitivity patterns. In this blog, we describe how to design the multi-curve framework. We do not claim that this is the only way or the best way. This is one possible way, which however turned out to work quite well within our system and happened to be easily integrated into our library.

Code snippets that will be shown below have been developed in C# using Visual Studio. Continue reading

Automation of FTP process - full implementation

The previously-implemented semi-automated business-used prototype of the daily fund transfer price (FTP) for the mortgage domain was moved to production from business to IT departments of a large Dutch bank and became an IT system under FAM responsibility.

The resulting fully-automated application was built on a consistent technology stack, which includes .NET, Visual Studio, C#, SQL-Server, SSIS package, QRM. The tool is accompanied by the corresponding graphical user interface (GUI) which was developed in ASP.NET.

This project turned out to be very challenging, especially because of: i) the interactions among various bank departments, including IT, FAM, FTP Centre and Mortgage Group; ii) the large technology stack involved. In all these cases we were in the lead.

Intuitions From The Multi-Curve Framework

How can we hedge within the multi-curve framework?

Let’s consider a simplified case. Our building blocks will be swaps only of various tenors and maturities with the following purposes:

  • Discounting instruments: we use 1-month tenor swaps of various maturities to construct the discounting curve.
  • Tenor instruments: we use 3-months, 6-months and 12-months tenor swaps to construct the forward curves. We denote them as 3M, 6M and 12M.

The exact swap data are given in the attached spreadsheets [a] and [b]. In particular:

  • the Data tab contains details of the input data and convention used in the calculation;
  • the Rows tab contains the matrix with the PV01s/IV01s of all the input instruments as rows;
  • the Columns tab contains the actual PV01/IV01 matrices as the transpose of the matrix in the previous tab;
  • our notation in these examples is that all the curves are ordered by discounting type (the first one is always the discounting curve) and increasing tenors.

Continue reading

ETL for Daily Liquidity Monitoring

Daily monitoring of liquidity has become a crucial job inside any bank. We implemented the Extract-Load-Transform (ETL) operations of liquidity tools for different trading desks for the modelling and risk-reporting departments in a large Dutch bank, which allows the bank to run its liquidity-monitoring tools daily.

Liquidity input data come from various sources and all have different formats. Some are Excel files, while some others are comma-separated text files. Moreover, date conventions are not standard and depends on external factors, such as Excel settings. In addition, all the different pieces of information have to be adjusted before they can be used. Such adjustments include specific selection and join operations.

Our input tool has been developed in C#. We have created in-memory databases and used LINQ to perform DB operations. The code has been unit-tested. Log text files and Excel output files are created daily. The tool has been accompanied by a self-contained user manual explaining the business logic, configuration setting and command-line arguments, exceptions that may arise during the execution.

Paper Accepted for Publication in the Wilmott Magazine

We are happy to announce that our paper Curiosities on the Monotone Preserving Cubic Splines  has been accepted for publication in the Wilmott Magazine.

The content of the paper is nicely summarised by the starting paragraph of the referee report: "The authors have two results. The first is a worthwhile observation that the Hyman constraint is automatically satisfied, and can thus be omitted. The second is a sensitivity calculation. These results deserve to be published ..".

Needless to say, we are happy for such an achievement and proud to get recognition for the quality of our research from an international refereed journal. This is for us a confirmation of our capacities and an additional boost of motivation.

A working version of the paper can be found in our library page. The final publication can be obtained directly from the Technical Papers section of the Wilmott Magazine journal here.

Multi-Curve - Useful References

We have recently started the project of including the multi-curve framework into the UDFinLib, our own financial library. The topic is delicate, as it consists of both research and implementation at once.

After the 2007-2008 world financial crisis it became clear that the classical single-curve framework that had been used until then was not appropriate to value products and to hedge portfolio's positions. All of a sudden credit risk was an every day's topic, collateral margins exploded and the previously small spreads between different-tenor swaps (OIS vs Libor, 3M-tenor vs 6M-tenor) could not be neglected anymore. Single-curve building, which treated instrument with different tenors in the same way, had to be upgraded to multi-curve.

In a nutshell, the multi-curve framework amounts to construct one discount curve and many tenor curves. The discount curve is typically built with OIS instruments, which are the best approximation for the risk free rate. All the other tenor curve are built with instruments with homogeneous tenors. The most used tenors are 3M, 6M, 9M, 12M. Typically, the longer the tenor the riskier the trade and hence the higher the corresponding rate.

In this blog we give a non-exhaustive list of references that helped us in both understanding the multi-curve and designing the process.

Articles

Books

Nice reading!

UD @ World Finance Conference (Buenos Aires, July 2015)

We are happy to announce that our work from last year on interest rate risk has been accepted for presentation at the World Finance Conference. The conference will take place in Buenos Aires (Argentina) on 21-24 July, where we will talk about our geometry paper (and maybe mention our related works).

More detailed information about the content of the conference will follow in future posts. Stay tuned!
 

Curiosities on the Monotone Preserving Cubic Spline

In this paper we describe some new features of the monotone-preserving cubic splines and the Hyman’s monotonicity constraint, that is implemented into various spline interpolation methods to ensure monotonicity. We find that, while the Hyman constraint is in general useful to enforce monotonicity, it can be safely omitted when the monotone-preserving cubic spline is considered. We also find that, when computing sensitivities, consistency requires making some specific assumptions about how to deal with non-differentiable locations, that become relevant for special values of the parameter space.

Keywords: Yield curve, fixed-income, interpolation, Hyman, monotone preserving cubic splines.

Click here for the full paper.